REGION SCORES WELL WITH 2023 WATERSHED REPORT CARD
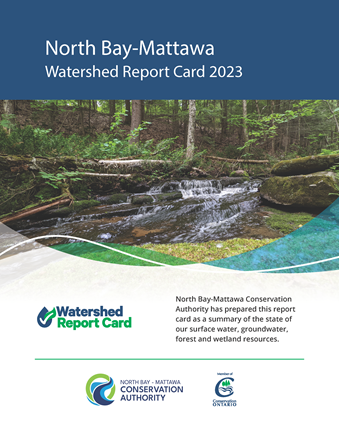
A Watershed Report Card for the region’s subwatersheds, released March 22, 2023, tells us that the overall watershed health is good, with room for improvement in a few subwatersheds.
“NBMCA’s 2023 Watershed Report Card provides an overview of water quality, forest conditions and wetland cover. The quality of our natural environment is essential for our communities’ health and economic wellbeing. The role that NBMCA plays in monitoring and reporting on environmental factors is instrumental in keeping us informed,” said Shelley Belanger, NBMCA’s Vice-chair.
“While grades varied throughout the 20 subwatersheds located within NBMCA's jurisdiction, overall groundwater quality, wetland cover and forest conditions scored an A (Excellent), while stream, river and lake water quality scored a B (Good)," said Chitra Gowda, NBMCA's CAO.
Conservation Authorities champion and develop Watershed Report Cards to provide Ontarians with the best available information about surface water quality, groundwater quality, forest conditions, and wetland cover in their watersheds.
NBMCA monitors conditions, collects and analyses data and reports on the results in the Watershed Report Card every 5 years (2013, 2018, 2023).
The purpose of the Watershed Report Card is to report on the health of watersheds through the use of key environmental indicators. They are a management and evaluation tool, which:
- benchmark conditions
- measure environmental change
- identify issues
- inform decision makers
Watershed report cards are a successful way to deliver a vast amount of technical information in a readily understandable and interesting way.
Report Card Categories
NBMCA's Watershed Report Card reports on five resource categories: surface water quality, reported separately as stream and river quality and lake water quality, groundwater quality, as well as forest conditions and wetland cover based on a set of indicators for each category.
These resource categories relate to two key Conservation Authority priorities: protecting and enhancing water quality and preserving and managing natural areas. While Conservation Authorities across the province consistently report on surface water quality (streams & rivers) and groundwater quality, NBMCA also reports on lake water quality given the significance of lakes within our watershed.
Surface Water Quality — Surface water is the water visible on the landscape that makes up our lakes, rivers, streams, and wetlands. Conservation Authorities assess the quality of lakes, rivers and streams by routinely measuring water chemistry (phosphorus) and organisms that live in the sediment at the bottom of streams and rivers, know as benthic macroinvertebrates.
Groundwater Quality — Groundwater is the water found beneath the earth's surface, in water-bearing layers known as aquifers. It is an important resource used by many local residents for water supply. Groundwater is difficult if not impossible to clean once contaminated, so it is critical to protect areas of groundwater recharge. Conservation Authorities monitor water chemistry (nutrients, chloride and nitrates)
Forest Conditions - Forests provide resiliency to climate change. They help to clean the air, protect biodiversity, prevent soil erosion, mitigate flooding, and regulate ecosystems. Forests also help to cool the land and air – nature's air conditioner! Conservation Authorities assess the area of their watersheds covered by forest, the amount of forest "interior" (areas that are more than 100 metres from the forest edge which provides critical habitat for many species including songbirds), and the amount of riparian forest (forested areas within 30 metres of lakes, rivers and streams.
Wetland Cover - Wetlands provide nature-based solutions for climate change. They are diverse habitats including marshes, swamps, bogs, and fens that help protect land from flooding and also improve water quality. There are 33,627 hectares of wetlands within the NBMCA watershed; approximately 12% of the land. Subwatershed wetland cover ranges from 5 to 31%.
Data for the report card was obtained from NBMCA's water quality sampling program, and in partnership Ministry of Environment, Conservation and Parks' Provincial Water Quality Monitoring Network (PWQMN), Lake Partner Program (LLP) and Provincial Groundwater Monitoring Network (PGMN) as well as the Land Information Ontario database. Wetland cover is from a 2018 NBMCA project to update wetland boundary mapping.
At NBMCA, watershed monitoring and reporting is an important part of the Integrated Watershed Management (IWM) process. Learn more about IWM at the IWM Section of the website.
To view Watershed Reports Cards issued by conservation authorities across the province, visit https://watershedcheckup.ca/

